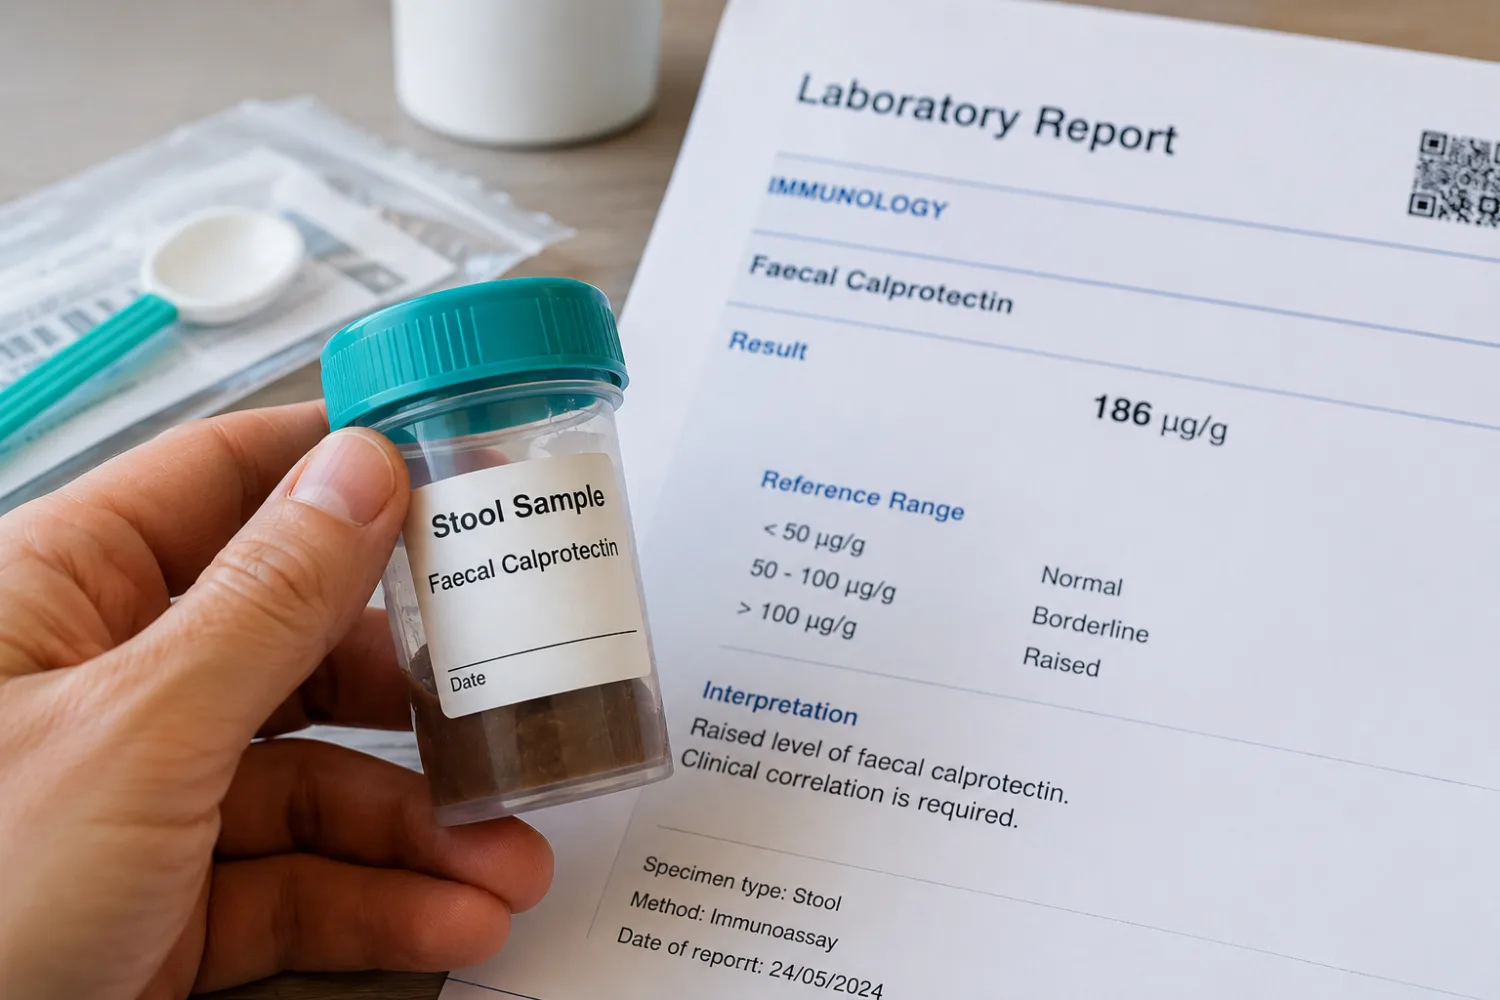
Faecal Calprotectin Results Explained: Low, Borderline and High Levels
Faecal calprotectin results explained: understand normal, borderline and high levels, IBD, IBS, repeat testing and when colonoscopy may be needed.
Best GP practices in Nottinghamshire, ranked using the latest available GP Patient Survey (GPPS) positive response results for “Overall experience (positiv…
Updated using the latest GP Patient Survey publication available in this county (latest publish date: 2025-07-10).
Showing up to 12 best GP practices in Nottinghamshire ranked by GPPS “Overall experience (positive)”. Open a practice to view full details and survey cards.
Ranked by GPPS positive response percentage (latest available survey for each practice).
| # | Practice | Town | Postcode | Score | CI | Response rate | Responses |
|---|---|---|---|---|---|---|---|
| 1 |
Published: 2025-07-10
•
metric_key: overallexp
|
NEWARK | NG22 0HT | 98.9% | 96.6%–99.7% | 38.4% | 117 / 305 |
| 2 |
Published: 2025-07-10
•
metric_key: overallexp
|
NEWARK | NG23 6PX | 94.8% | 92.8%–96.3% | 50% | 128 / 256 |
| 3 |
Published: 2025-07-10
•
metric_key: overallexp
|
NOTTINGHAM | NG2 7PG | 94.5% | 83.7%–98.3% | 37.8% | 119 / 315 |
| 4 |
Published: 2025-07-10
•
metric_key: overallexp
|
NOTTINGHAM | NG2 7SD | 94.4% | 81.4%–98.5% | 42% | 124 / 295 |
| 5 |
Published: 2025-07-10
•
metric_key: overallexp
|
MANSFIELD | NG21 0JP | 91.6% | 83.5%–96% | 32.6% | 102 / 313 |
| 6 |
Published: 2025-07-10
•
metric_key: overallexp
|
NOTTINGHAM | NG17 7BG | 90.9% | 87.5%–93.4% | 26% | 119 / 457 |
| 7 |
Published: 2025-07-10
•
metric_key: overallexp
|
NOTTINGHAM | NG9 3HF | 90.6% | 87.4%–93% | 35.4% | 105 / 297 |
| 8 |
Published: 2025-07-10
•
metric_key: overallexp
|
RETFORD | DN22 0AB | 89.9% | 86.8%–92.3% | 39.1% | 93 / 238 |
| 9 |
Published: 2025-07-10
•
metric_key: overallexp
|
NOTTINGHAM | NG13 8NY | 89.9% | 84%–93.7% | 45.6% | 113 / 248 |
| 10 |
Published: 2025-07-10
•
metric_key: overallexp
|
NOTTINGHAM | NG3 5LB | 89.3% | 84.1%–93% | 43% | 139 / 323 |
| 11 |
Published: 2025-07-10
•
metric_key: overallexp
|
NOTTINGHAM | NG9 4ET | 88.9% | 72.2%–96.1% | 36.6% | 108 / 295 |
| 12 |
Published: 2025-07-10
•
metric_key: overallexp
|
NOTTINGHAM | NG17 7LG | 88.6% | 85.6%–91.1% | 31.4% | 117 / 373 |
Map points are shown for practices with coordinates available.
Practices that nearly made the Best list (next best in this county).
| Practice | Town | Postcode | Score |
|---|---|---|---|
| NOTTINGHAM | NG5 7BP | 86.9% | |
| NOTTINGHAM | NG2 6PS | 86.4% | |
| SUTTON-IN-ASHFIELD | NG17 2NF | 86% | |
| SUTTON-IN-ASHFIELD | NG17 1JW | 86% | |
| LOUGHBOROUGH | LE12 6JG | 85.8% | |
| NOTTINGHAM | NG16 3HU | 85.7% | |
| NOTTINGHAM | NG16 6BT | 85.6% | |
| NOTTINGHAM | NG17 7BG | 85.3% |
Helpful guides about GP practices, patient experience, appointments and choosing local NHS services.
Faecal calprotectin results explained: understand normal, borderline and high levels, IBD, IBS, repeat testing and when colonoscopy may be needed.
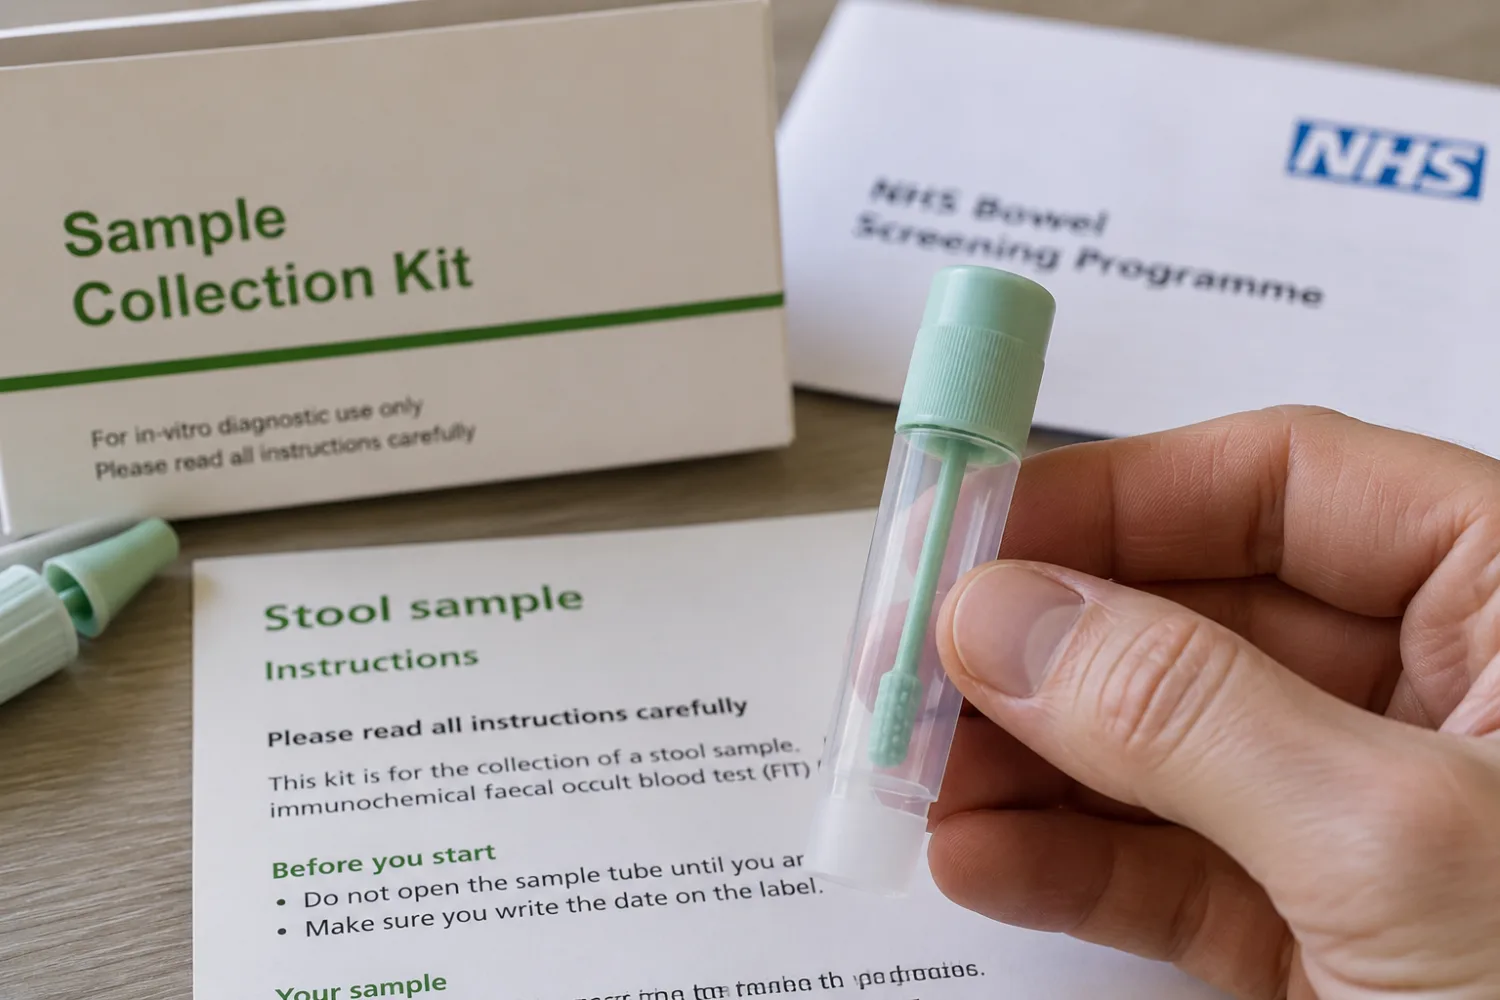
FIT test results explained for UK patients: understand µg Hb/g levels, positive and negative results, the 10 threshold, colonoscopy and what happens next.

Blood tests before weight loss injections explained: HbA1c, kidney, liver, cholesterol, thyroid and nutrient checks before Mounjaro or Wegovy.

Diabetes screening explained: who should get tested, key risk factors, HbA1c and glucose tests, NHS Health Checks, pregnancy screening and when testing is urgent.

Diabetes blood test results explained, including HbA1c, glucose, cholesterol, kidney function, urine ACR, liver tests and what to ask your GP.

Well woman blood tests explained: learn what female health checks can show, from hormones, ferritin and thyroid to vitamins, cholesterol and HbA1c.
Browse other areas, or switch back to full GP listings.
Put your healthcare business in front of an engaged UK audience through sponsored articles, category visibility, banner placements and expert author profiles.
Sponsored articles from £50
View sponsorship optionsWe reply to every enquiry within 1 business day